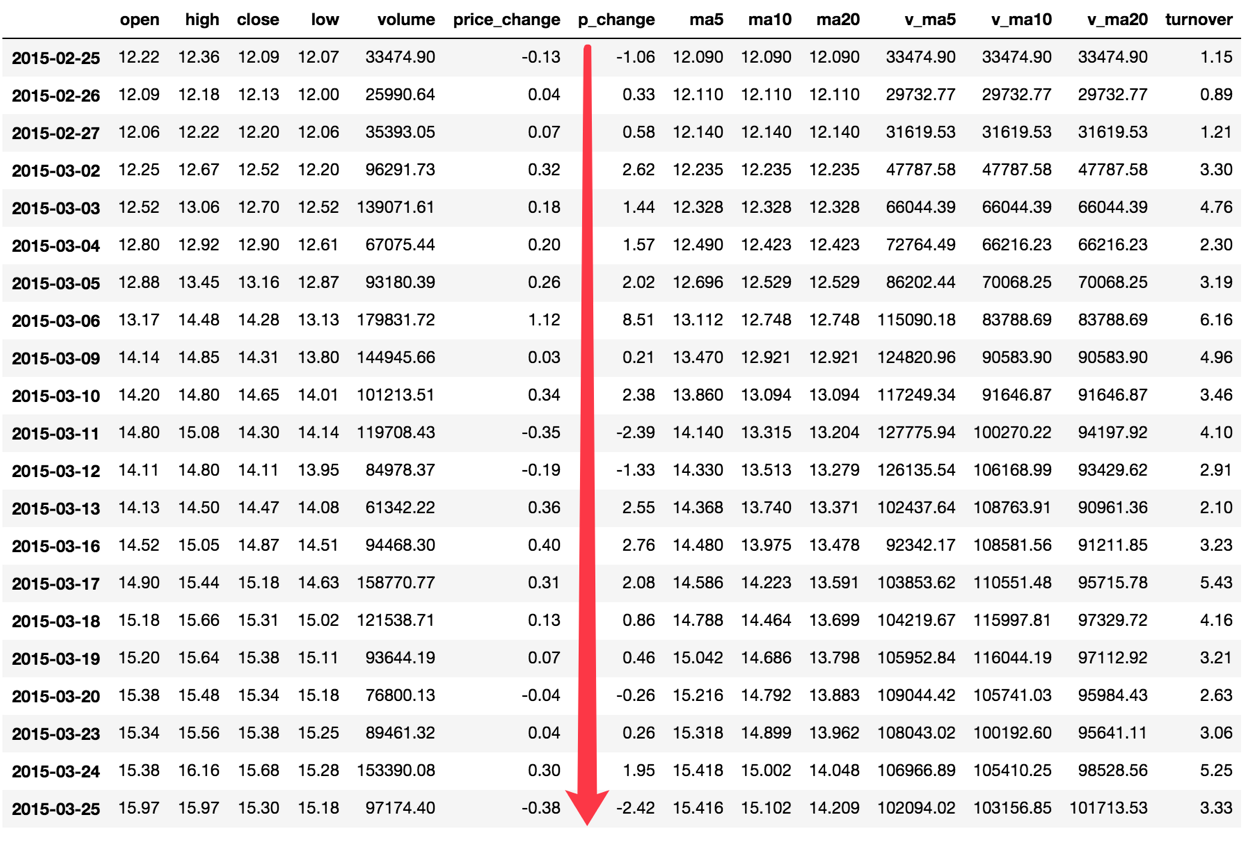
DataFrame 运算
算术运算
比如进行数学运算加上具体的一个数字
add(other)
sub(other)
python
import pandas as pd

df = pd.read_csv('stock_day.csv')
print(df.open.add(1))


2018-02-27    24.53
2018-02-26    23.80
2018-02-23    23.88
2018-02-22    23.25
2018-02-14 22.49逻辑运算
逻辑运算符号
例如筛选
data["open"] > 23的日期数据data["open"] > 23返回逻辑结果
pythonimport pandas as pd df = pd.read_csv('stock_day.csv') print(df['open'] > 23) 2018-02-27 True 2018-02-26 False 2018-02-23 False 2018-02-22 False 2018-02-14 Falsepython# 逻辑判断的结果可以作为筛选的依据 print(df[df['open'] > 23].head())
完成多个逻辑判断
pythonprint(df[(df["open"] > 23) & (df["open"] < 24)].head())
逻辑运算函数
query(expr)
- expr:查询字符串
通过 query 使得刚才的过程更加方便简单
pythonprint(df.query("open<24 & open>23").head())isin(values)
例如判断 'open' 是否为 23.53 和 23.85
python# 可以指定值进行一个判断,从而进行筛选操作 print(df[df["open"].isin([23.53, 23.85])])
统计运算
describe
综合分析:能够直接得出很多统计结果,count, mean, std, min, max 等
python
# 计算平均值、标准差、最大值、最小值
df.describe()
统计函数
Numpy 当中已经详细介绍,在这里我们演示 min(最小值), max(最大值), mean(平均值), median(中位数), var(方差), std(标准差) ,mode( 众数) 结果:
| 方法 | 效果 |
|---|---|
| count() | 计数项 |
| sum() | 所有项求和 |
| mean()、median() | 均值与中位数 |
| first()、last() | 第一项与最后一项 |
| min()、max() | 最小值与最大值 |
| abs() | 绝对值 |
| prod() | 所有项乘积 |
| std()、var() | 标准差与方差 |
对于单个函数去进行统计的时候,坐标轴还是按照默认列“columns” (axis=0, default),如果要对行“index”需要指定 (axis=1)
max()、min()
python# 使用统计函数:0 代表列求结果,1 代表行求统计结果 print(df.max(0)) open 34.99 high 36.35 close 35.21 low 34.01 volume 501915.41 price_change 3.03 p_change 10.03 turnover 12.56 my_price_change 3.41 dtype: float64std()、var()
python# 方差 print(df.var(0)) open 1.545255e+01 high 1.662665e+01 close 1.554572e+01 low 1.437902e+01 volume 5.458124e+09 price_change 8.072595e-01 p_change 1.664394e+01 turnover 4.323800e+00 my_price_change 6.409037e-01 dtype: float64 # 标准差 print(df.std(0)) open 3.930973 high 4.077578 close 3.942806 low 3.791968 volume 73879.119354 price_change 0.898476 p_change 4.079698 turnover 2.079375 my_price_change 0.800565 dtype: float64median():中位数
中位数为将数据从小到大排列,在最中间的那个数为中位数。如果没有中间数,取中间两个数的平均值。
pythondf = pd.DataFrame({'COL1' : [2,3,4,5,4,2], 'COL2' : [0,1,2,3,4,2]}) df.median() COL1 3.5 COL2 2.0 dtype: float64idxmax()、idxmin()
python# 求出最大值的位置 df.idxmax(axis=0) open 2015-06-15 high 2015-06-10 close 2015-06-12 low 2015-06-12 volume 2017-10-26 price_change 2015-06-09 p_change 2015-08-28 turnover 2017-10-26 my_price_change 2015-07-10 dtype: object # 求出最小值的位置 df.idxmin(axis=0) open 2015-03-02 high 2015-03-02 close 2015-09-02 low 2015-03-02 volume 2016-07-06 price_change 2015-06-15 p_change 2015-09-01 turnover 2016-07-06 my_price_change 2015-06-15 dtype: object
累计统计函数
| 函数 | 作用 |
|---|---|
cumsum | 计算前 1/2/3/…/n 个数的和 |
cummax | 计算前 1/2/3/…/n 个数的最大值 |
cummin | 计算前 1/2/3/…/n 个数的最小值 |
cumprod | 计算前 1/2/3/…/n 个数的积 |
那么这些累计统计函数怎么用?

以上这些函数可以对 series 和 dataframe 操作
这里我们按照时间的从前往后来进行累计
排序
python# 排序之后,进行累计求和 df1 = df.sort_index()对 p_change 进行求和
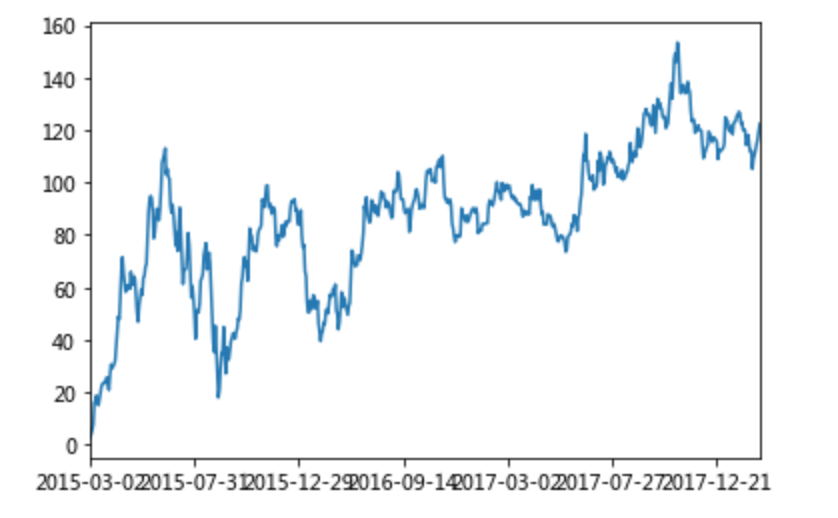
pythonstock_rise = df1['p_change'] # plot 方法集成了前面直方图、条形图、饼图、折线图 print(stock_rise.cumsum()) 2015-03-02 2.62 2015-03-03 4.06 2015-03-04 5.63 2015-03-05 7.65 2015-03-06 16.16 2015-03-09 16.37 2015-03-10 18.75 2015-03-11 16.36 2015-03-12 15.03 2015-03-13 17.58 2015-03-16 20.34 2015-03-17 22.42 2015-03-18 23.28 2015-03-19 23.74 2015-03-20 23.48 2015-03-23 23.74绘制图像
pythonimport matplotlib.pyplot as plt # plot 显示图形 stock_rise.cumsum().plot() # 需要调用 show,才能显示出结果 plt.show()
小结
算术运算【知道】
逻辑运算【知道】
- 逻辑运算符号
- 逻辑运算函数
- 对象 .query()
- 对象 .isin()
统计运算【知道】
- 对象 .describe()
- 统计函数
- 累积统计函数